0%

又称为 上采样 下采样

数据不平衡问题

默认阈值(比如二分类正反例中0.5)导致模型输出倾向于数据多的类别

解决办法

  1. 调整分类阈值,偏向数据少的类别
  2. 选择ROC或F1作为评估标准
  3. 过采样、欠采样

过采样

将样本数量少的类别生成的样本数量和数量多的类别一样多,合成新的样本来缓解类不平衡

注:随机过采样采用简单复制样本增加少数类样本,导致模型不够泛化

欠采样

从数量多的类别中抽取与等量的样本数据,抛弃一些样本来缓解类不平衡

SMOTE

经典过采样

人工合成数据(Synthetic Minority Over-sampling Technique)

分析数量较少类别的样本数据,基于“插值”来为少数类合成新样本,并添加到数据集

  1. 确定采样倍率 N(N为整数,N>=1)
  2. 计算少数类 样本x(i)到本样本欧式距离,得到x(i)的k个近邻
  3. 随机选择近邻x^, xnew = x + rand(0,1)*(x^-x),重复N次,得到N个新样本
  4. 对所有少数类样本x(i)执行1,2操作,合成NT个新样本

欠采样(Undersampling)和过采样(Oversampling)是处理不平衡数据集的常见方法,用于解决正负样本数量差异较大的情况。欠采样是减少多数类样本的数量,而过采样是增加少数类样本的数量。

以下是使用Python实现欠采样和过采样的示例代码,分别使用imbalanced-learn库来演示:

首先,确保已安装 imbalanced-learn 库,可以通过以下命令安装:

1
pip install imbalanced-learn

接下来,使用下面的代码示例:

  1. 欠采样示例
1
2
3
4
5
6
7
8
9
10
11
12
13
14
15
16
17
18
19
20
21
22
23
24
25
26
from imblearn.under_sampling import RandomUnderSampler
from collections import Counter
from sklearn.datasets import make_classification
import matplotlib.pyplot as plt

# 创建一个不平衡的示例数据集
X, y = make_classification(n_samples=1000, weights=[0.99], random_state=42)

# 统计类别分布
counter = Counter(y)
print("Original class distribution:", counter)

# 进行欠采样
undersample = RandomUnderSampler(sampling_strategy=0.5, random_state=42)
X_resampled, y_resampled = undersample.fit_resample(X, y)

# 统计欠采样后的类别分布
counter_resampled = Counter(y_resampled)
print("Resampled class distribution:", counter_resampled)

# 绘制类别分布图
plt.bar(counter_resampled.keys(), counter_resampled.values())
plt.xlabel('Class')
plt.ylabel('Count')
plt.title('Resampled Class Distribution')
plt.show()
  1. 过采样示例
1
2
3
4
5
6
7
8
9
10
11
12
13
14
15
16
17
18
19
20
21
22
23
from imblearn.over_sampling import RandomOverSampler

# 创建一个不平衡的示例数据集
X, y = make_classification(n_samples=1000, weights=[0.99], random_state=42)

# 统计类别分布
counter = Counter(y)
print("Original class distribution:", counter)

# 进行过采样
oversample = RandomOverSampler(sampling_strategy=0.5, random_state=42)
X_resampled, y_resampled = oversample.fit_resample(X, y)

# 统计过采样后的类别分布
counter_resampled = Counter(y_resampled)
print("Resampled class distribution:", counter_resampled)

# 绘制类别分布图
plt.bar(counter_resampled.keys(), counter_resampled.values())
plt.xlabel('Class')
plt.ylabel('Count')
plt.title('Resampled Class Distribution')
plt.show()

在上述代码中,我们使用make_classification函数创建了一个不平衡的示例数据集,然后分别使用RandomUnderSamplerRandomOverSampler进行欠采样和过采样。最后,绘制了欠采样和过采样后的类别分布图。

请注意,实际应用中您可能需要调整采样策略、超参数等来满足具体问题的需求。

梯度下降法(Gradient Descent)是一种优化算法,用于找到函数的局部最小值。它在机器学习中常用于训练模型,通过迭代地调整参数,使目标函数的值逐渐减小,从而达到最优解。

以下是一个使用Python实现梯度下降法的示例代码,用于最小化一个简单的二次函数:

1
2
3
4
5
6
7
8
9
10
11
12
13
14
15
16
17
18
19
20
21
22
23
24
25
26
27
28
29
30
31
32
33
34
35
36
37
38
39
40
import numpy as np
import matplotlib.pyplot as plt

# 定义目标函数和其梯度
def target_function(x):
return x**2 + 4*x + 4

def gradient(x):
return 2*x + 4

# 梯度下降算法
def gradient_descent(initial_x, learning_rate, num_iterations):
x = initial_x
x_history = [x]
for _ in range(num_iterations):
x -= learning_rate * gradient(x)
x_history.append(x)
return x, x_history

# 初始化参数和超参数
initial_x = -5
learning_rate = 0.1
num_iterations = 20

# 运行梯度下降算法
optimal_x, x_history = gradient_descent(initial_x, learning_rate, num_iterations)

# 绘制函数和梯度下降路径
x_values = np.linspace(-6, 2, 400)
y_values = target_function(x_values)
plt.plot(x_values, y_values, label='Function')
plt.scatter(x_history, [target_function(x) for x in x_history], c='red', label='Gradient Descent Path')
plt.xlabel('x')
plt.ylabel('y')
plt.legend()
plt.title('Gradient Descent Example')
plt.show()

print("Optimal x:", optimal_x)
print("Minimum value:", target_function(optimal_x))

在上述代码中,我们首先定义了一个简单的二次函数作为目标函数,并计算了其梯度。然后,实现了梯度下降算法,其中包括初始参数、学习率和迭代次数等超参数。最后,我们运行梯度下降算法,并绘制了目标函数和梯度下降的路径。

请注意,这只是一个简单的梯度下降示例,用于说明概念。在实际应用中,您可能需要考虑更复杂的目标函数、调整学习率、使用不同的梯度下降变体等。

KKT条件

基本思想

当从模型总体随机抽取n组样本观测值后,最合理的参数估计量应该使得从模型中抽取该n组样本观测值的概率最大,而不是像最小二乘估计法旨在得到使得模型能最好地拟合样本数据的参数估计量。
最大似然估计(Maximum Likelihood Estimation,MLE)是一种常用的参数估计方法,用于根据观测数据来估计模型的参数,使得观测数据在该模型下的概率最大化。在统计学和机器学习中广泛应用。

以下是一个使用Python实现最大似然估计的示例代码:

1
2
3
4
5
6
7
8
9
10
11
12
13
14
15
16
17
18
19
20
21
22
23
24
25
26
27
28
29
30
31
32
33
34
import numpy as np
from scipy.stats import norm
import matplotlib.pyplot as plt

# 生成服从正态分布的随机样本
np.random.seed(0)
mu_true = 2.0
sigma_true = 1.5
data = np.random.normal(mu_true, sigma_true, 100)

# 定义似然函数
def likelihood(params, data):
mu, sigma = params
log_likelihood = np.sum(np.log(norm.pdf(data, loc=mu, scale=sigma)))
return log_likelihood

# 通过最大化似然函数来估计参数
from scipy.optimize import minimize

initial_params = [0, 1] # 初始参数猜测
result = minimize(lambda params: -likelihood(params, data), initial_params, method='Nelder-Mead')

estimated_mu, estimated_sigma = result.x
print("Estimated mu:", estimated_mu)
print("Estimated sigma:", estimated_sigma)

# 绘制原始数据和拟合的正态分布
plt.hist(data, bins=20, density=True, alpha=0.6, label='Data')
x = np.linspace(-5, 10, 100)
plt.plot(x, norm.pdf(x, loc=estimated_mu, scale=estimated_sigma), 'r', label='MLE Fit')
plt.xlabel('Value')
plt.ylabel('Probability Density')
plt.legend()
plt.show()

在上述代码中,我们首先生成了服从正态分布的随机样本数据。然后,定义了似然函数,该函数计算给定参数下观测数据的似然。接着,我们使用scipy.optimize.minimize函数来最大化似然函数,从而估计模型参数。

通过最大似然估计,我们得到了估计的均值和标准差,然后绘制了原始数据的直方图以及拟合的正态分布。这个示例展示了如何使用最大似然估计来拟合一个简单的正态分布模型。在实际应用中,您可能会遇到更复杂的模型和数据。

自相关性

数据清洗是数据预处理的重要步骤,用于识别和处理数据集中的错误、缺失值、重复值等问题,以确保数据的质量和可用性。以下是一些常见的数据清洗方法以及使用Python的示例代码:

  1. 处理缺失值

缺失值可能会影响模型性能,需要进行处理。常见的方法包括删除带有缺失值的行、使用均值或中位数填充缺失值等。

1
2
3
4
5
6
7
8
9
10
11
12
13
14
15
16
17
18
19
20
import pandas as pd
import numpy as np

# 创建示例数据帧
data = {'A': [1, 2, np.nan, 4],
'B': [5, np.nan, 7, 8]}
df = pd.DataFrame(data)

# 删除包含缺失值的行
cleaned_df = df.dropna()

# 使用均值填充缺失值
mean_fill_df = df.fillna(df.mean())

print("Original DataFrame:")
print(df)
print("\nDataFrame after dropping rows with missing values:")
print(cleaned_df)
print("\nDataFrame after filling missing values with mean:")
print(mean_fill_df)
  1. 处理重复值

重复值可能会导致分析结果失真,需要对其进行处理。可以使用drop_duplicates函数删除重复行。

1
2
3
4
5
6
7
8
9
10
11
12
# 创建示例数据帧
data = {'A': [1, 2, 2, 4],
'B': [5, 6, 6, 8]}
df = pd.DataFrame(data)

# 删除重复行
deduplicated_df = df.drop_duplicates()

print("Original DataFrame:")
print(df)
print("\nDataFrame after removing duplicate rows:")
print(deduplicated_df)
  1. 异常值处理

异常值可能会影响模型的稳定性和预测性能。一种方法是使用统计方法识别和处理异常值。

1
2
3
4
5
6
7
8
9
10
11
12
13
# 创建示例数据帧
data = {'A': [10, 20, 30, 200],
'B': [5, 15, 25, 50]}
df = pd.DataFrame(data)

# 标准差方法识别和处理异常值
mean = df['A'].mean()
std = df['A'].std()
threshold = 2 # 可根据需求调整
df['A'] = np.where(np.abs(df['A'] - mean) > threshold * std, mean, df['A'])

print("Original DataFrame:")
print(df)

以上只是数据清洗的一些常见方法示例,实际应用中根据问题的性质和数据的特点,可能需要采用不同的处理方式。

奇异值分解(Singular Value Decomposition,SVD)是一种常用的矩阵分解方法,将一个矩阵分解成三个矩阵的乘积。SVD在降维、矩阵逆、推荐系统等领域有广泛应用。

SVD将一个矩阵 ( A ) 分解为三个矩阵的乘积:( A = U \Sigma V^T ),其中:

  • ( U ) 是一个正交矩阵,它的列向量是 ( A A^T ) 的特征向量。
  • ( \Sigma ) 是一个对角矩阵,其对角线上的元素是 ( A A^T ) 特征值的平方根。
  • ( V^T ) 是另一个正交矩阵,它的列向量是 ( A^T A ) 的特征向量。

以下是一个使用Python实现奇异值分解的示例代码,使用了numpy库:

首先,确保已安装 numpy 库,可以通过以下命令安装:

1
pip install numpy

接下来,使用下面的代码示例:

1
2
3
4
5
6
7
8
9
10
11
12
13
14
15
16
import numpy as np

# 创建一个示例矩阵
A = np.array([[1, 2, 3],
[4, 5, 6],
[7, 8, 9]])

# 进行奇异值分解
U, S, VT = np.linalg.svd(A)

print("U matrix:")
print(U)
print("\nS matrix (diagonal values):")
print(np.diag(S))
print("\nVT matrix:")
print(VT)

在上述代码中,我们首先创建了一个示例矩阵 ( A ),然后使用np.linalg.svd函数进行奇异值分解。分别得到了矩阵 ( U ),对角矩阵 ( \Sigma ) 的对角线元素和矩阵 ( V^T )。

奇异值分解的一个常见应用是主成分分析(PCA),它通过对数据矩阵进行奇异值分解来实现数据降维。

多元线性回归是一种用于建模和预测多个自变量与一个因变量之间关系的统计方法。它是线性回归的扩展,适用于多个自变量的情况。在多元线性回归中,我们试图找到一个线性关系,使得自变量的线性组合能够较好地预测因变量。

以下是一个使用Python实现多元线性回归的示例代码,使用了numpyscikit-learn库:

首先,确保已安装 numpyscikit-learn 库,可以通过以下命令安装:

1
pip install numpy scikit-learn

接下来,使用下面的代码示例:

1
2
3
4
5
6
7
8
9
10
11
12
13
14
15
16
17
18
19
20
21
22
23
24
25
26
27
28
29
import numpy as np
from sklearn.model_selection import train_test_split
from sklearn.linear_model import LinearRegression
from sklearn.metrics import mean_squared_error

# 生成示例数据
np.random.seed(0)
X = np.random.rand(100, 3) # 100个样本,3个特征
y = 2 * X[:, 0] + 3 * X[:, 1] + 4 * X[:, 2] + 1 + np.random.randn(100) # 使用线性关系生成因变量

# 划分训练集和测试集
X_train, X_test, y_train, y_test = train_test_split(X, y, test_size=0.2, random_state=42)

# 创建多元线性回归模型
model = LinearRegression()

# 训练模型
model.fit(X_train, y_train)

# 在测试集上进行预测
y_pred = model.predict(X_test)

# 计算均方误差
mse = mean_squared_error(y_test, y_pred)
print("Mean Squared Error:", mse)

# 打印模型参数(系数和截距)
print("Coefficients:", model.coef_)
print("Intercept:", model.intercept_)

在上述代码中,我们首先生成了一个示例数据集,其中包含3个特征和一个因变量。然后,我们使用train_test_split函数将数据集划分为训练集和测试集。接着,我们创建了一个多元线性回归模型,并使用fit方法训练模型。在测试集上进行预测,并计算均方误差来衡量模型性能。

请注意,这只是一个简单的多元线性回归示例。在实际应用中,您可能需要考虑特征选择、模型评估、特征缩放等问题,以获得更好的回归模型。

分片属性:分片概率、分片频度、自由度、凝固程度

自由度

文本片段的自由运用程度

如果一个文本片段能够算作一个词的话,它应该能够灵活地出现在各种不同的环境中,具有非常丰富的左邻字集合和右邻字集合。

信息熵

衡量信息量大小

用信息熵来衡量一个文本片段的左邻字集合和右邻字集合丰富程度。考虑这么一句话”吃葡萄不吐葡萄皮不吃葡萄倒吐葡萄皮”,”葡萄”一词出现了四次,其中左邻字分别为 {吃, 吐, 吃, 吐} ,右邻字分别为 {不, 皮, 倒, 皮} 。根据公式,”葡萄”一词的左邻字的信息熵为 - (1/2) · log(1/2) - (1/2) · log(1/2) ≈ 0.693 ,它的右邻字的信息熵则为 - (1/2) · log(1/2) - (1/4) · log(1/4) - (1/4) · log(1/4) ≈ 1.04 。可见,在这个句子中,”葡萄”一词的右邻字更加丰富一些。

一个文本片段的自由运用程度为它的左邻字信息熵和右邻字信息熵中的较小值。

通过信息熵算法,可以很好的区分一些专有名词像玫瑰、蝙蝠等,一些地名像新西兰、伦敦等,这些自由度较低的词汇的

用于分类和回归的非监督学习方法,通过简单的决策规则(if-else)预测目标

优缺点

  • 思想简单,可视乎表达,易理解,可以处理多分类问题
  • 可能会过拟合,此时需要剪枝、采用设置最小样本数目或树的深度
  • 基于启发式算法,节点采用贪婪算法(局部最优),不能保证全局最优,可以随机抽取样本,训练多个树
  • 过于复杂的概念,无法表达

决策树 CART

CART: classifcation and regression tree

irsi数据集构建分类决策树

from sklearn.datasets import load_iris
from sklearn import tree

#加载iris数据集
iris = load_iris()

clf = tree.DecisionTreeClassifier()
clf = clf.fit(iris.data, iris.target)

import pydotplus
dot_data = tree.export_graphviz(clf, out_file=None)
#dot_data = tree.export_graphviz(clf, out_file=None, 
                              feature_names=iris.feature_names,  
                              class_names=iris.target_names,  
                              filled=True, rounded=True,  
                              special_characters=True)
graph = pydotplus.graph_from_dot_data(dot_data)
#导出决策树
graph.write_pdf("iris.pdf") 
#Image(graph.create_png())

iris树

sklearn example

import numpy as np
import matplotlib.pyplot as plt

from sklearn.datasets import load_iris
from sklearn.tree import DecisionTreeClassifier

# Parameters
n_classes = 3
plot_colors = "ryb"
plot_step = 0.02

# Load data
iris = load_iris()

for pairidx, pair in enumerate([[0, 1], [0, 2], [0, 3],
                                [1, 2], [1, 3], [2, 3]]):
    # We only take the two corresponding features
    X = iris.data[:, pair]
    y = iris.target

    # Train
    clf = DecisionTreeClassifier().fit(X, y)

    # Plot the decision boundary
    plt.subplot(2, 3, pairidx + 1)

    x_min, x_max = X[:, 0].min() - 1, X[:, 0].max() + 1
    y_min, y_max = X[:, 1].min() - 1, X[:, 1].max() + 1
    xx, yy = np.meshgrid(np.arange(x_min, x_max, plot_step),
                         np.arange(y_min, y_max, plot_step))
    plt.tight_layout(h_pad=0.5, w_pad=0.5, pad=2.5)

    Z = clf.predict(np.c_[xx.ravel(), yy.ravel()])
    Z = Z.reshape(xx.shape)
    cs = plt.contourf(xx, yy, Z, cmap=plt.cm.RdYlBu)

    plt.xlabel(iris.feature_names[pair[0]])
    plt.ylabel(iris.feature_names[pair[1]])

    # Plot the training points
    for i, color in zip(range(n_classes), plot_colors):
        idx = np.where(y == i)
        plt.scatter(X[idx, 0], X[idx, 1], c=color, label=iris.target_names[i],
                    cmap=plt.cm.RdYlBu, edgecolor='black', s=15)

plt.suptitle("Decision surface of a decision tree using paired features")
plt.legend(loc='lower right', borderpad=0, handletextpad=0)
plt.axis("tight")
plt.show()

iris树

链接:https://scikit-learn.org/stable/auto_examples/tree/plot_iris.html#sphx-glr-auto-examples-tree-plot-iris-py
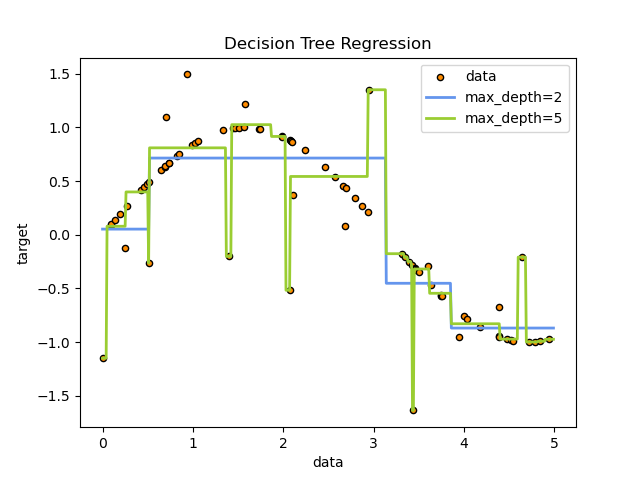
决策树回归

max_depth:图的深度,值太大会导致过拟合

# Import the necessary modules and libraries
import numpy as np
from sklearn.tree import DecisionTreeRegressor
import matplotlib.pyplot as plt

# Create a random dataset
rng = np.random.RandomState(1)
X = np.sort(5 * rng.rand(80, 1), axis=0)
y = np.sin(X).ravel() #学习sin曲线
y[::5] += 3 * (0.5 - rng.rand(16)) #干扰值

# Fit regression model
regr_1 = DecisionTreeRegressor(max_depth=2)
regr_2 = DecisionTreeRegressor(max_depth=5)
regr_1.fit(X, y)
regr_2.fit(X, y)

# Predict
X_test = np.arange(0.0, 5.0, 0.01)[:, np.newaxis]
y_1 = regr_1.predict(X_test)
y_2 = regr_2.predict(X_test)

# Plot the results
plt.figure()
plt.scatter(X, y, s=20, edgecolor="black",
            c="darkorange", label="data")
plt.plot(X_test, y_1, color="cornflowerblue",
         label="max_depth=2", linewidth=2)
plt.plot(X_test, y_2, color="yellowgreen", label="max_depth=5", linewidth=2)
plt.xlabel("data")
plt.ylabel("target")
plt.title("Decision Tree Regression")
plt.legend()
plt.show()

iris树

链接:https://scikit-learn.org/stable/auto_examples/tree/plot_tree_regression.html#sphx-glr-auto-examples-tree-plot-tree-regression-py
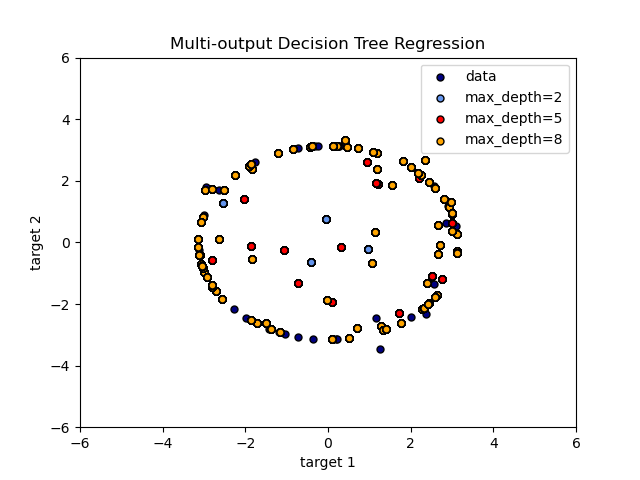
多输出问题

import numpy as np
import matplotlib.pyplot as plt
from sklearn.tree import DecisionTreeRegressor

# Create a random dataset
rng = np.random.RandomState(1)
X = np.sort(200 * rng.rand(100, 1) - 100, axis=0)
y = np.array([np.pi * np.sin(X).ravel(), np.pi * np.cos(X).ravel()]).T #输出X正弦 余弦
y[::5, :] += (0.5 - rng.rand(20, 2)) #干扰

# Fit regression model
regr_1 = DecisionTreeRegressor(max_depth=2)
regr_2 = DecisionTreeRegressor(max_depth=5)
regr_3 = DecisionTreeRegressor(max_depth=8)
regr_1.fit(X, y)
regr_2.fit(X, y)
regr_3.fit(X, y)

# Predict
X_test = np.arange(-100.0, 100.0, 0.01)[:, np.newaxis]
y_1 = regr_1.predict(X_test)
y_2 = regr_2.predict(X_test)
y_3 = regr_3.predict(X_test)

# Plot the results
plt.figure()
s = 25
plt.scatter(y[:, 0], y[:, 1], c="navy", s=s,
            edgecolor="black", label="data")
plt.scatter(y_1[:, 0], y_1[:, 1], c="cornflowerblue", s=s,
            edgecolor="black", label="max_depth=2")
plt.scatter(y_2[:, 0], y_2[:, 1], c="red", s=s,
            edgecolor="black", label="max_depth=5")
plt.scatter(y_3[:, 0], y_3[:, 1], c="orange", s=s,
            edgecolor="black", label="max_depth=8")
plt.xlim([-6, 6])
plt.ylim([-6, 6])
plt.xlabel("target 1")
plt.ylabel("target 2")
plt.title("Multi-output Decision Tree Regression")
plt.legend(loc="best")
plt.show()

iris树

链接:https://scikit-learn.org/stable/auto_examples/tree/plot_tree_regression_multioutput.html#sphx-glr-auto-examples-tree-plot-tree-regression-multioutput-py

不确定性程度的物理量

自封闭系统的运动向均匀分布—熵总是增加的

信息熵(Entropy)是一种用于衡量随机变量不确定性的度量。在信息论中,熵表示一个随机变量的不确定性或信息量。对于分类问题,熵越高,表示随机变量的不确定性越大,即数据分布越均匀。

信息熵的计算公式如下:

[ H(X) = -\sum_{i=1}^{n} P(x_i) \cdot \log_2(P(x_i)) ]

其中,( n ) 是类别数,( P(x_i) ) 是随机变量 ( X ) 取值为 ( x_i ) 的概率。

以下是一个使用Python实现信息熵计算的示例代码:

1
2
3
4
5
6
7
8
9
10
11
12
13
14
15
import numpy as np

def entropy(probabilities):
# 避免概率为0时取对数导致无限大
epsilon = 1e-15
probabilities = np.clip(probabilities, epsilon, 1 - epsilon)
entropy = -np.sum(probabilities * np.log2(probabilities))
return entropy

# 示例概率分布
probabilities = np.array([0.2, 0.3, 0.5])

# 计算信息熵
entropy_value = entropy(probabilities)
print("Entropy:", entropy_value)

在上述代码中,我们定义了一个entropy函数,接受概率分布作为输入,并计算信息熵。为了避免取对数时出现无限大,我们使用了一个小的epsilon值进行裁剪。然后,通过对概率分布与对数化后的概率分布进行元素级相乘,最后取负数并求和,得到信息熵值。

信息熵可以用于决策树等算法中,用于选择合适的特征进行数据分割,从而达到更好的分类效果。

联合熵

条件熵

信息增益

ID3

信息增益率

C4.5

gini系数

CART

互信息